
Last updated: August 2026. Based on Department of Home Affairs current invitation round data for April to June 2026, and the published Migration Program planning levels. Figures current as of publication date.
NIV Invitation Round April to June 2026: A Record Quarter Into a Smaller Year
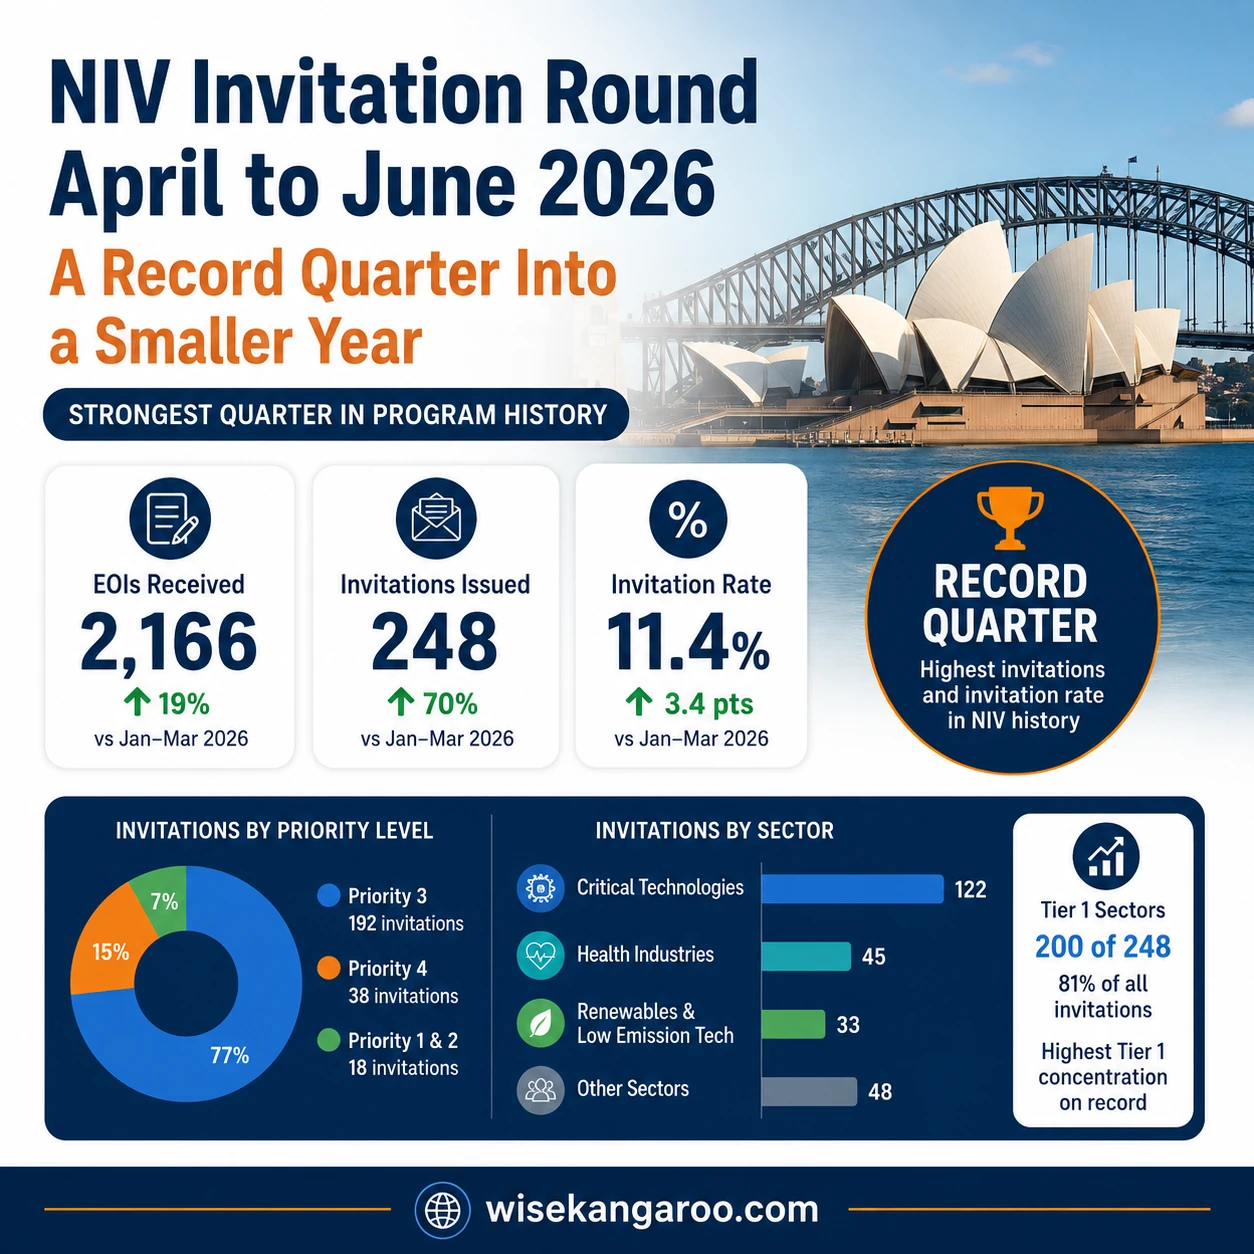
The Department of Home Affairs has published the National Innovation Visa (NIV) invitation round data for April to June 2026, and it is the strongest quarter the program has ever had. 248 invitations from 2,166 Expressions of Interest, an invitation rate of 11.4%. Both numbers are program records.
That closes out the 2025-26 financial year. It also lands right as the Talent and Innovation planning level for 2026-27 drops to 3,500 places. So this NIV invitation round is worth reading twice: once as a headline, and once as the last quarter of an envelope that no longer exists.
Our previous analysis covered Q4 2025 and Q1 2026, where the program recorded its first quarter-on-quarter decline. That decline has now been comprehensively reversed.
The Headline Numbers: April to June 2026
| Measure | Jan-Mar 2026 | Apr-Jun 2026 | Change |
|---|---|---|---|
| EOIs received | 1,815 | 2,166 | +19% |
| Invitations issued | 146 | 248 | +70% |
| Invitation rate | 8.0% | 11.4% | +3.4 pts |
The previous invitation record was 226 in Q4 2025. This quarter beat it by 10%, and did so on a smaller EOI pool, which is why the rate jumped so sharply.
Invitations by Priority Level
| Priority | Jan-Mar 2026 | Apr-Jun 2026 |
|---|---|---|
| Priority 1 (global top-of-field awards) | 0 | <5 |
| Priority 2 (government nominated, Form 1000) | 15 | <20 |
| Priority 3 (Tier 1 sector achievers) | 113 | 192 |
| Priority 4 (Tier 2 sector achievers) | 18 | 38 |
The Department suppresses small cells, but the totals still tell you something useful. Priority 3 and Priority 4 together account for 230 of the 248 invitations, which means Priority 1 and Priority 2 combined came to exactly 18.
Invitations by Sector
| Sector | Jan-Mar 2026 | Apr-Jun 2026 |
|---|---|---|
| Tier 1 - Critical Technologies | 66 | 122 |
| Tier 1 - Health Industries | 34 | 45 |
| Tier 1 - Renewables and Low Emission Technologies | 18 | 33 |
| Tier 2 - Financial Services and FinTech | 7 | 14 |
| Tier 2 - Agri-food and AgTech | 5 | 9 |
| Tier 2 - Defence Capabilities and Space | <5 | 7 |
| Tier 2 - Education | 6 | 6 |
| Tier 2 - Infrastructure and Transport | <5 | <5 |
| Tier 2 - Resources | <5 | <5 |
| Other - Sports and the Arts | 6 | 6 |
Tier 1 sectors took 200 of the 248 invitations. That is 81% of the quarter, the highest Tier 1 concentration the program has recorded.
The Full FY2025-26 Picture
One quarter is a data point. A financial year is a pattern. Here is the whole of 2025-26, which is the first complete program year the NIV has run under.
| Quarter | EOIs | Invitations | Invitation Rate |
|---|---|---|---|
| Jul-Sep 2025 | 1,841 | 122 | 6.6% |
| Oct-Dec 2025 | 2,368 | 226 | 9.5% |
| Jan-Mar 2026 | 1,815 | 146 | 8.0% |
| Apr-Jun 2026 | 2,166 | 248 | 11.4% |
| FY2025-26 total | 8,190 | 742 | 9.1% |
742 invitations from 8,190 EOIs. Roughly eleven EOIs for every invitation issued.
For context on the whole program: since the NIV opened in December 2024, approximately 14,345 EOIs have produced 924 invitations, an all-time rate of 6.4%. The 2025-26 rate of 9.1% is meaningfully better than that lifetime average, which tells you the program spent its first full year getting faster, not slower.
Where the FY2025-26 invitations went
| Sector | FY2025-26 total | Share of all invitations |
|---|---|---|
| Critical Technologies | 342 | 46% |
| Health Industries | 145 | 20% |
| Renewables and Low Emission Technologies | 91 | 12% |
| Tier 1 combined | 578 | 78% |
| All Tier 2 sectors plus Sports and the Arts | 164 | 22% |
FY2025-26 by priority level
| Priority | FY2025-26 total | Share |
|---|---|---|
| Priority 3 (Tier 1) | 555 | 75% |
| Priority 4 (Tier 2) | 128 | 17% |
| Priority 1 and 2 combined | 59 | 8% |
Three quarters of every invitation in the entire financial year went to Priority 3. If you are planning an NIV strategy, that single number should shape most of it. Our NIV priority pathways guide sets out how the four priority levels and the two sector tiers actually work under Ministerial Direction 120.
Six Things the Data Shows That the Headline Does Not
1. The record quarter was a Priority 3 event
Priority 3 went from 113 to 192, up 70%. The total went up 70%. Those are the same number, and that is not a coincidence. The entire shape of the record quarter was driven by Tier 1 sector candidates. Priority 4 doubled in percentage terms, but from a small base, adding only 20 invitations.
If you are reading this as a Tier 1 candidate, the quarter was genuinely excellent. If you are reading it as a Tier 2 candidate, it was good, but you were not what made it a record.
2. Critical Technologies is not just dominant, its share is still climbing
Critical Technologies has taken 39%, 47%, 45% and 49% of total invitations across the last four quarters. Nearly half of every invitation issued in April to June 2026 went to a single sector.
Across the full financial year, Critical Technologies alone accounted for 342 of 742 invitations. That is more than Health Industries and Renewables combined.
Critical Technologies is broad by design. It covers AI and machine learning, quantum, advanced manufacturing and robotics, cyber, advanced materials, space technologies and biotech. If your work genuinely sits inside one of those subfields but your EOI is filed under a Tier 2 sector, that framing is costing you. Our guide for academic researchers and our tech founders analysis both go into how to position the evidence.
3. Tier 2 recovered, but it is still the shock absorber
Priority 4 across four quarters: 20, then 52, then 18, then 38. That is not a trend, it is a bounce pattern.
The reading that fits the data is that Tier 2 receives whatever capacity is left after Priority 1, 2 and 3 candidates have been considered. In a big quarter there is a lot left over. In a constrained quarter there is not. Tier 2 volume is a residual, not an allocation. That distinction matters a great deal for the year ahead, for reasons covered below.
4. Sports and the Arts has no sector route at all
This one takes a moment of arithmetic, but it is worth it.
Tier 1 sectors received 200 invitations. Priority 3, which is defined as Tier 1 sector achievement, received 192. Tier 2 sectors received 42, while Priority 4, defined as Tier 2 sector achievement, received 38. And Sports and the Arts, which sits in neither tier, received 6.
Add up the gaps and you get 18, which is exactly the Priority 1 and Priority 2 total. In other words, the six Sports and the Arts invitations could only have come through Priority 1 or Priority 2, because there is no Tier 1 or Tier 2 sector for them to sit in.
For athletes and creative professionals, that is the whole strategic picture in one line. You are not competing for a share of the monthly Priority 3 and Priority 4 rounds, because you are not in them. Your realistic route is a Form 1000 government agency nomination into Priority 2, or an international top-of-field award into Priority 1. Our creative artists case study walks through two applicants who succeeded on record strength, and our nominator guide covers what a credible nomination actually looks like.
5. Priority 2 is real but it is not scaling
Priority 2 across the year came in at 17, under 10, 15, and under 20. Add Priority 1 and the whole non-sector route contributed 59 invitations for the entire financial year, or 8%.
There has been substantial public activity around state and territory nomination programs through 2025 and 2026, which we cover in our state nomination comparison. The volume has not followed. Treat a government nomination as a genuine accelerator if you can get one, particularly if you are in Tier 2 or Sports and the Arts, but not as a volume pathway.
6. EOI volume swings, and the swings are not random
EOI submissions across the year: 1,841, then 2,368, then 1,815, then 2,166. That is a repeating up-down-up rhythm rather than steady growth.
More telling is the longer view. The NIV averaged 3,078 EOIs per quarter in its launch half-year, when 6,155 arrived across January to June 2025. Across 2025-26 it averaged 2,048 per quarter, a third lower. The applicant pool has thinned and concentrated: fewer speculative EOIs, more serious ones. That is consistent with the ratio improving from roughly 34 EOIs per invitation at launch to 11 in 2025-26.
Not sure which priority level your profile actually lands in? The gap between a Tier 1 and Tier 2 framing of the same career can be months of waiting. Talk to us about your NIV positioning before you lodge, because an EOI cannot be edited once it is submitted.
The FY2026-27 Squeeze: What the Planning Level Cut Really Means
Here is where the forward-looking analysis gets interesting, and where most of the commentary is getting the arithmetic wrong.
The number everyone is quoting
The Talent and Innovation category for 2026-27 is set at 3,500 places, down from a widely quoted 5,300 in 2025-26. That reads as a 34% cut, and it is usually explained away as simply removing dead capacity from the closed Global Talent, Distinguished Talent and Business Innovation and Investment programs.
The number that actually matters
The 5,300 figure is a combination of two separate lines from the 2025-26 program. As we reported when the 2025-26 details were released, the breakdown was:
| 2025-26 category | Places |
|---|---|
| Talent and Innovation (includes the NIV and closed Global Talent and Distinguished Talent) | 4,300 |
| Business Innovation and Investment (separate line) | 1,000 |
| Combined | 5,300 |
For 2026-27 there is no separate Business Innovation and Investment line. It has been folded into a single consolidated Talent and Innovation figure of 3,500.
So the honest comparison is not 5,300 down to 3,500. It is this: the NIV-bearing line went from 4,300 to 3,500, a cut of 800 places, and that smaller line now also has to absorb the legacy Business Innovation and Investment grants that previously had a dedicated 1,000 places of their own.
That is a tighter squeeze than the headline suggests, not a looser one. The commentary that reads the cut as painless because “it is only closing closed programs” has the direction of the effect backwards.
One invitation is not one place, and this is where the maths turns
Planning levels count visa grants. Invitation rounds count invitations. Between the two sit a 60-day lodgement window, an application, and a full merits assessment that plenty of invited candidates do not clear.
But there is a second and much larger difference, and it runs the other way. A place is consumed by every person on the visa, not by every invitation issued. An NIV applicant can include a partner and dependent children, and each of those people takes a place out of the same envelope. One invitation to a candidate with a spouse and two children is four places, not one.
That multiplier is not small. The Department’s own 2024-25 Migration Program Report shows that of the 132,148 Skill stream places delivered, only 45.8% went to primary applicants. Secondary applicants, meaning partners and dependent children, took the other 54.2%. Across the Skill stream as a whole, one primary applicant consumes roughly 2.2 places.
Apply that to the NIV and the picture changes completely.
| Places per primary applicant | FY2025-26 (742 invitations) against the 4,300 line | Record quarter annualised (992) against the 3,500 line |
|---|---|---|
| 1.0 (primary only, unrealistic) | 742 places, 17% | 992 places, 28% |
| 2.2 (Skill stream average) | 1,620 places, 38% | 2,165 places, 62% |
| 2.5 | 1,855 places, 43% | 2,480 places, 71% |
| 3.0 | 2,226 places, 52% | 2,976 places, 85% |
At the Department’s own Skill stream ratio, a repeat of the April to June quarter would consume around 62% of the entire 2026-27 Talent and Innovation envelope on its own. At three places per applicant, which is an ordinary family of three, it consumes 85%.
And that is before a single legacy grant. The same 3,500 has to cover the remaining Global Talent, Distinguished Talent and Business Innovation and Investment pipeline, which last year had 1,000 places set aside on its own line.
What is different this year
For the first two years of the program the evidence bar was doing the limiting. The Department was constrained by how many candidates clear “exceptional and outstanding achievement”, not by how many places it had.
That is no longer safely true. On plausible family sizes the 2026-27 envelope is not comfortably slack, it is most of the way spoken for at the current invitation run-rate. The gap between the two constraints has closed, and the April to June quarter is what closed it.
One honest caveat: the Department does not publish a primary-to-secondary split for the NIV specifically, so the 2.2 figure is the Skill stream average rather than a measured NIV number. If anything it understates the NIV case, because this cohort skews toward established mid-career professionals who are more likely to bring a family than the average skilled migrant, not less.
Three predictions worth planning against
Expect Q3 2026 to reset lower. The April to June surge closed out a program year under the larger envelope. In 2025-26, the opening quarter was the smallest of the four at 122 invitations. Departments do not typically open a tighter year at a record pace, and on the places arithmetic above the Department has a concrete reason to pace itself this time. Treat 248 as a ceiling, not a new floor.
Expect Tier 2 to absorb the reduction first. Priority 4 has already demonstrated that it functions as a residual. A smaller envelope compresses the residual before it touches Priority 3. If your profile sits in Tier 2 and there is a defensible repositioning into Critical Technologies, Health Industries or Renewables, 2026-27 is the year to do the work.
Expect the Tier 1 concentration to hold or tighten. 81% of the record quarter went to Tier 1 sectors. The Department has framed the reduced allocation around focusing on internationally recognised exceptional achievement. Nothing in that framing suggests a broadening.
What This Means If You Are Considering the NIV
If you are in Critical Technologies, Health Industries or Renewables, the data is on your side and has been for four straight quarters. Build against an invitation rate closer to 9% than 11.4%, because the record quarter is unlikely to be the new baseline. And get your EOI in rather than waiting for a “better” round: in a year where places are tight, early in the program year is a materially better place to be sitting than late.
If your profile sits in Tier 2, the year ahead is the tightest the program has run. Your two levers are repositioning into a Tier 1 sector where that is genuinely defensible, or securing a Form 1000 government nomination to move into Priority 2. Both take months. Start now rather than after a quiet quarter confirms the squeeze.
If you are in Sports and the Arts, plan around Priority 1 or Priority 2, because the arithmetic says there is no third option. The nomination is not a formality in your case, it is the pathway.
If you are holding an older EOI, remember that an EOI cannot be edited after submission. New awards, publications, patents, funding rounds or serious media coverage since you lodged are only visible to the Department if you lodge a fresh EOI. In a tightening year, a stale EOI is a real cost.
A worked example
Consider a hypothetical candidate, a senior data infrastructure engineer with a decade in payments technology, several granted patents and two international conference keynotes. Their instinct is to file under Financial Services and FinTech, because that is the industry on their CV.
On the 2025-26 data, that framing puts them in Priority 4, a category that received 128 invitations for the entire year. Reframed around the machine learning and advanced systems work that the patents actually describe, the same person is a Critical Technologies candidate in Priority 3, a category that received 555.
The career is identical. The evidence is identical. The queue is not. That is the single highest-leverage decision most NIV candidates make, and it is made before they submit anything. We have written up three real invitation profiles that show how this framing plays out in practice.
Frequently Asked Questions
Q: How many invitations were issued in the April to June 2026 NIV invitation round? A: 248 invitations from 2,166 Expressions of Interest, an invitation rate of 11.4%. Both the invitation count and the rate are program records, beating the previous peak of 226 invitations in October to December 2025.
Q: Does the reduced 2026-27 planning level mean fewer NIV invitations? A: Quite possibly, yes. The key point most commentary misses is that a place is consumed by every person on the visa, not by every invitation. Partners and dependent children each take a place, and across the Skill stream only 45.8% of places go to primary applicants. On that ratio, a repeat of the April to June 2026 quarter would consume roughly 62% of the entire 3,500-place envelope before any legacy Global Talent or Business Innovation and Investment grants are counted. The places have gone from comfortably slack to genuinely tight.
Q: Which sector received the most NIV invitations? A: Critical Technologies, by a wide margin. It took 122 of 248 invitations in April to June 2026, and 342 of 742 across the full 2025-26 financial year, which is 46% of everything issued.
Q: I work in a Tier 2 sector. Should I still submit an EOI? A: Yes, if your achievements genuinely meet the exceptional and outstanding standard. But go in understanding that Priority 4 received 17% of invitations in 2025-26 and behaves as a residual after higher priorities are considered. Explore whether a Tier 1 framing is defensible, or whether a government agency nomination into Priority 2 is achievable, before you lodge.
Q: Can I update my EOI if my achievements improve? A: No. An EOI cannot be edited after submission. If your record has strengthened materially since you lodged, submit a fresh EOI so the stronger evidence is what the Department assesses in the next round.
Q: How often are NIV invitation rounds held? A: Monthly. Priority 1 and Priority 2 candidates are invited as soon as they are identified, while Priority 3 and Priority 4 candidates are considered in monthly rounds. The Department publishes the aggregate data quarterly, which is what this analysis covers.
Get Your Positioning Right Before the Round, Not After
The NIV bar is high and it is getting no lower. But the margin between an invited profile and one that sits in the pool is often about how the case is framed rather than how strong the underlying record is. Sector choice, priority level, nominator strategy and evidence sequencing are all decisions you make before you submit, and none of them can be undone afterwards.
If you want a clear read on where your profile sits against the current data, get in touch and we will walk you through it.
You may also find these guides useful:
- NIV Invitation Rounds Q4 2025 and Q1 2026 Analysis
- NIV Q3 2025 Invitation Trends
- NIV Priority Pathways Explained
- National Innovation Visa: Complete Guide
- NIV for Academic Researchers: Evidence Guide
- Fast NIV Invitations for Tech Founders
- NIV State Nomination Comparison: NSW, VIC, SA, QLD
- Three NIV Invitations in Three Months
- From EB-1A, EB-1B or O-1 to the National Innovation Visa
Disclaimer: This article is for general information only and is current as of 6 August 2026. It is not legal advice. Invitation round figures are as published by the Department of Home Affairs for April to June 2026, and cells marked “<5” or “<20” are suppressed by the Department. For advice specific to your circumstances, consult a Registered Migration Agent. Always verify current NIV invitation data and Migration Program planning levels with the Department of Home Affairs.